Announcement March 9, 2026 • 2 min read
Public Dashboard for Avalanche Validator
We are thrilled to announce that Shield Crypto has made available a public dashboard to provide visibility on the performance of our validator on the Avalanche network.

Why a public dashboard?
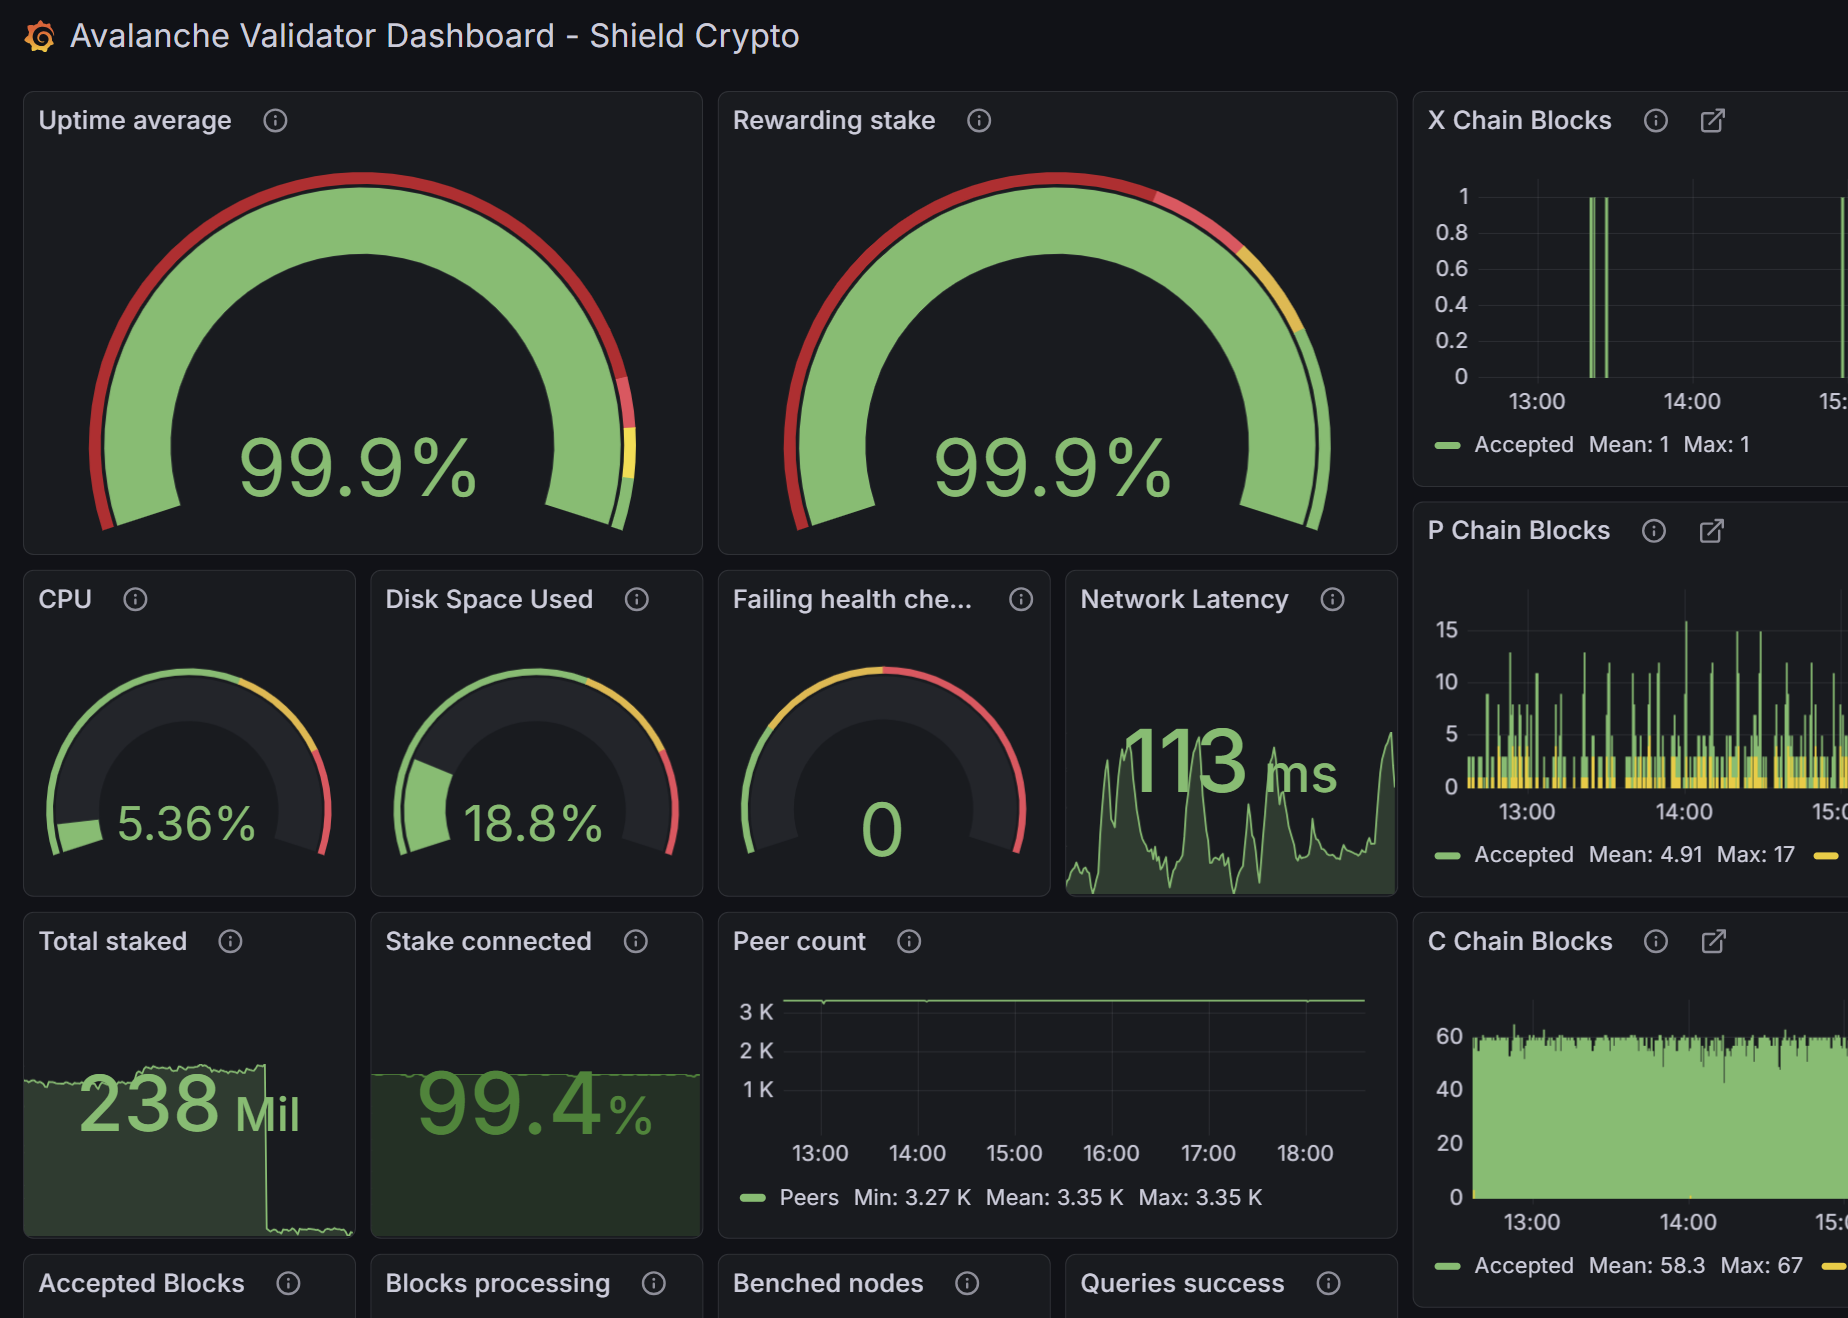
Shield Crypto has launched a public, 24/7 Grafana dashboard to provide real-time, transparent monitoring of its Avalanche validator's performance, including uptime, latency, and system health metrics.
This initiative aims to build trust with delegators by allowing them to directly verify the high-availability infrastructure. The key metrics are:
The key metrics are:
- Uptime average: Uptime Average measures the percentage of time a node is online and responsive. Nodes must maintain, for the validation period, at least 90% uptime to secure rewards.
- Rewarding Stake: Rewarding Stake indicates the portion of the network's voting power that confirms the node has met this uptime threshold, with higher percentages ensuring reward eligibility
- Disk Space Used: Nodes running with sufficient disk space ensure optimal performance and data integrity. We monitor this metric to ensure our nodes operate efficiently and we perform regular offline pruning operations between validation periods to ensure maximum storage utilization
- CPU: Maintaining low CPU utilization is a critical pillar of our infrastructure strategy. By ensuring our validator operates with significant hardware overhead, we eliminate the risk of computational bottlenecks during periods of intense network activity or rapid state synchronization. This 'performance buffer' guarantees that our node can process transactions with sub-second finality even under peak load, providing our delegators with the highest level of reliability and ensuring that hardware limitations never stand in the way of their rewards